What makes a new hymn popular?
general
frequency
new hymns
In previous posts, I have done an in-depth analysis of the first, second, third, fourth, and fifth batches of new hymns. This post is an analysis of all the new hymns generally.
Note
This post is based on 62,081 sacrament meetings since May 30, 2024 when the new batches came out.
Popularity
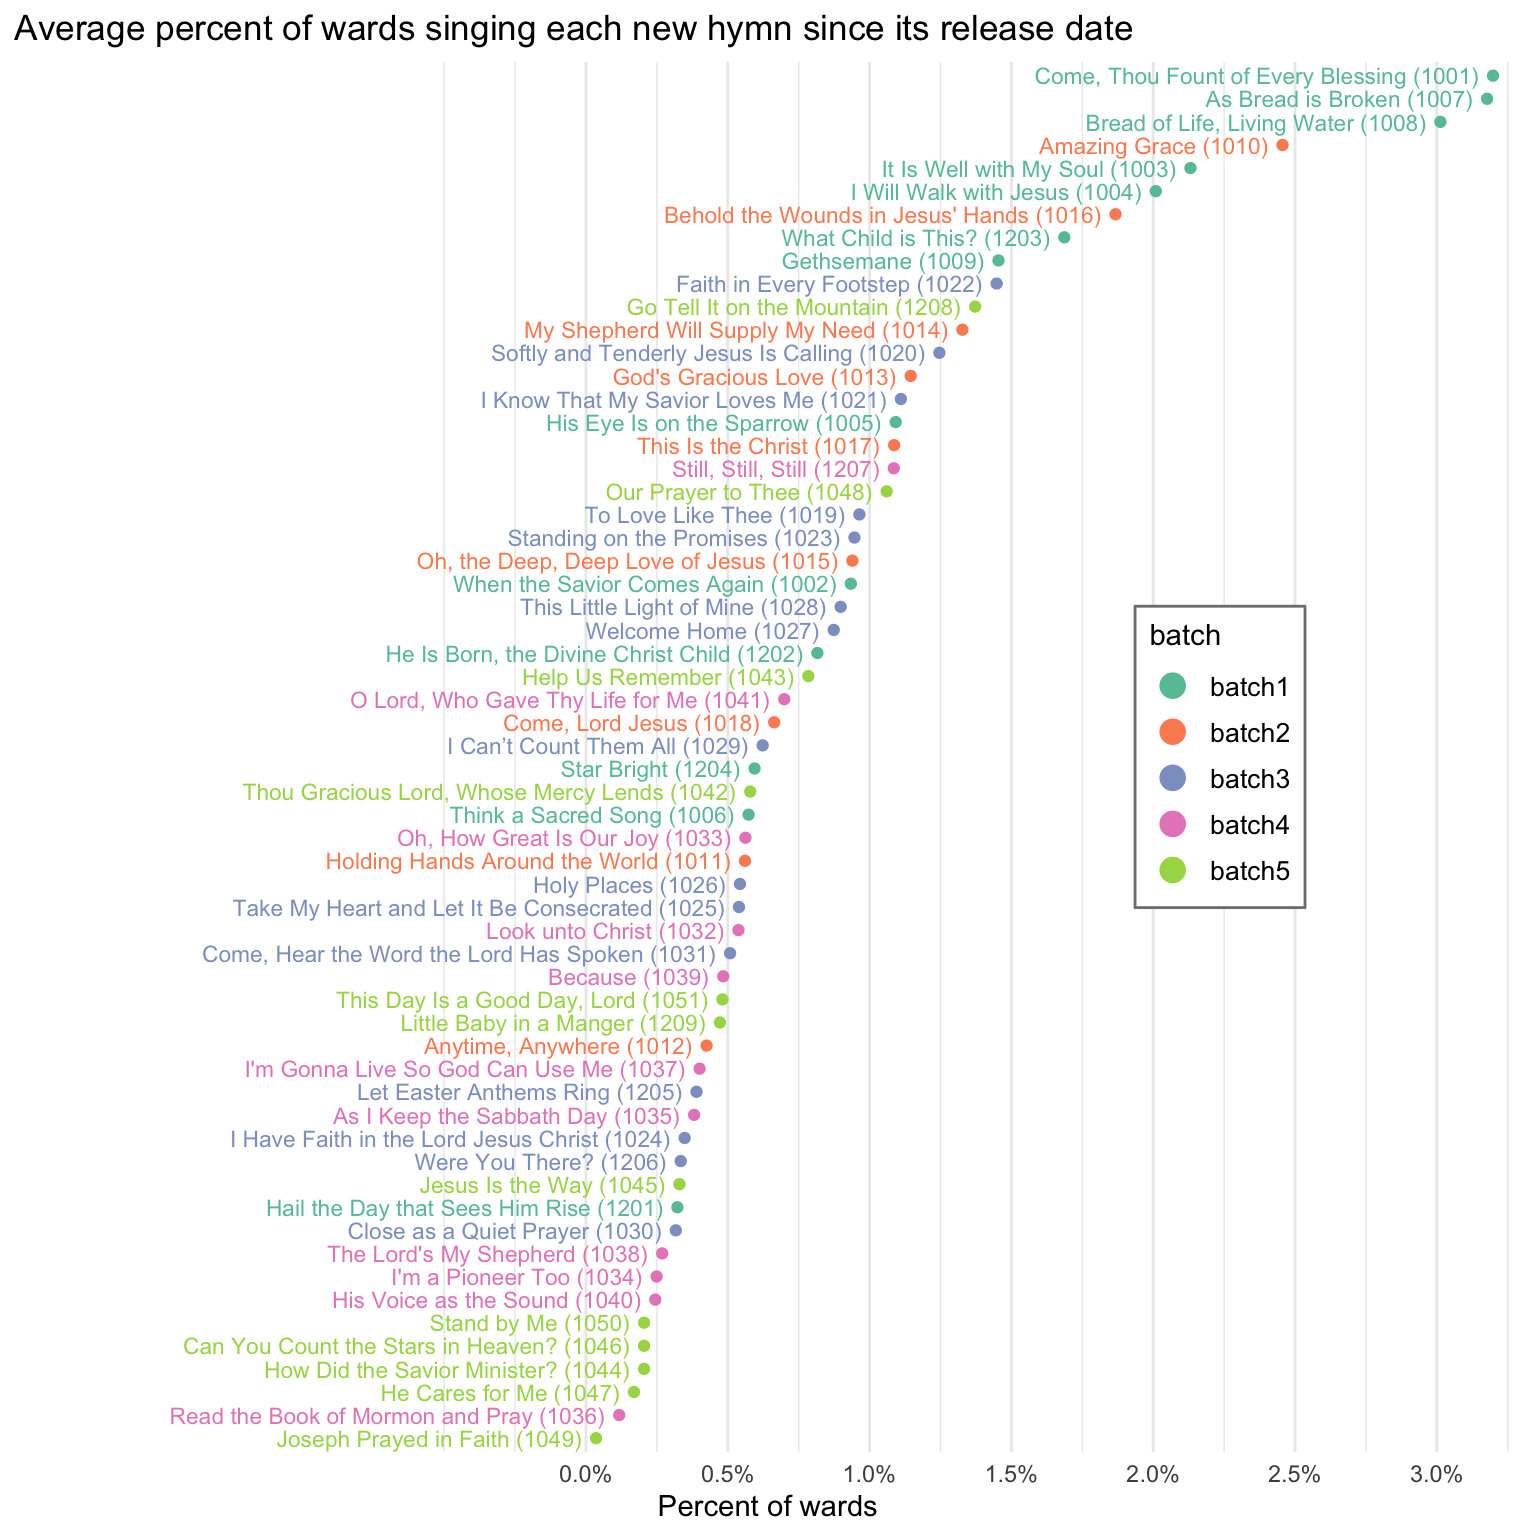
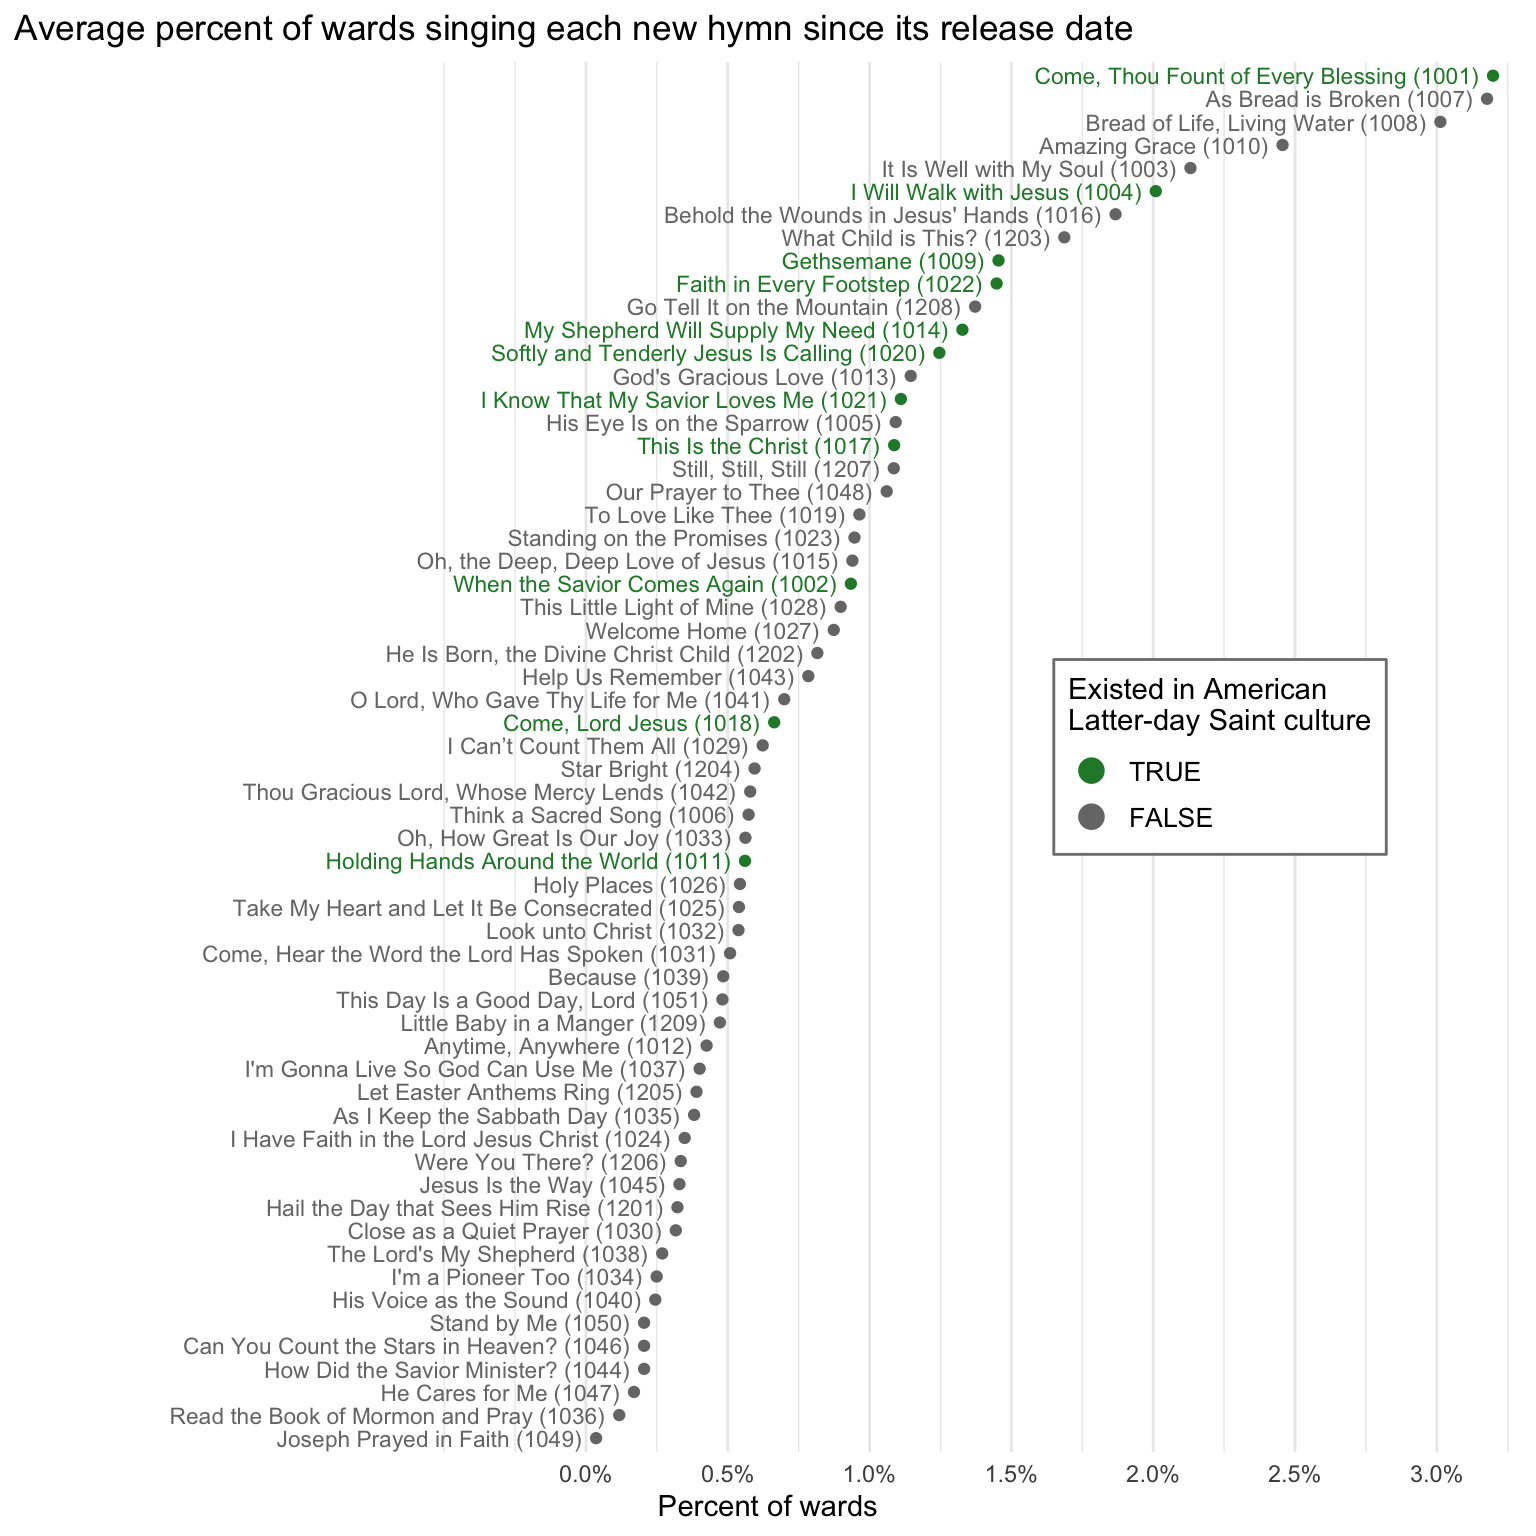
In my overview page, I show which hymns have been the most popular since June 2024. But, pooling together all the data since then gives an unfair advantage to the earlier batches since they have been out longer and therefore have had more chances to be sung. So, I want to show the popularity of each hymn after controlling for how many weeks it has been available.
I think this plot says a lot, so let’s break it down. On a general level, we see that the most common hymns are sung by 2%–3% of wards every Sunday. That’s not a tremendous amount, about one out of every 40–50 wards for any one of those top six or so hymns. But that’s roughly the same as saying that, this Sunday, there’s something like a 20%–30% chance that at least one ward in your stake will sing
1 There are usually 52 Sundays in a year, but we have two set aside for General Conference and two set aside for Stake Conference, so that leaves 48 sacrament meetings per year. 1 divided by 48 is about 0.0208. So if a hymn is sung 2.08% of the time, that’s about once per year.
On the other end of the plot, we have a list of the least common new hymns. These are ones that relatively few wards have ever sung, at least as congregational hymns. Some of the lowest on this list are sitting around 0.2% of wards. That means that, for any of these bottom 10 hymns, there’s only about a 1–3% chance of a ward singing it next Sunday, even for larger stakes. Your ward might sing it only once every 10 years! (Of course, these are new hymns, so it’s silly to make speculations like that.) That makes these about as popular as
As an interesting tidbit, I recently heard from someone who works at the church and is involved in data analysis of the new hymns. He said that the most popular new hymn is
To inject my opinion on these results so far, I am surprised at where some hymns are on this list. I thought for sure that when
But lots of things might influence where on the plot a hymn ends up. So, let’s go through some factors that might have an influence. Fair warning, the following discussions include some statistical analysis. If you’re scared of those numbers or don’t know how to interpret them, I believe you can still get some useful information from the text. Just skip the next section and move on to the results.
Methods for statistical analysis
Here are some details on the statistics I’m doing. I’m just doing a linear regression model. The dependent variable is the proportion of wards that each hymn has been sung in since its respective release date. Since the data was skewed right, I did a Box-Cox transformation to make it more normal. The lambda parameter was estimated to be 0.149 using Guerrero’s (1993) method. The resulting distribution was normal, according to a Shapiro-Wilk test of normality (\(W\) = 0.987, \(p\) = 0.791).
For the dependent variables, I include the batch (coded as a categorical rather than ordinal variable) and the following binary variables: whether it’s an SATB arrangement, whether it had a complex flow (see below), whether it’s a sacrament hymn, whether it’s a hymn that was already prominent in LDS culture, whether it was already in a non-English LDS hymnal, whether it’s a well-known Christian hymn outside of LDS culture, whether it’s an African American spiritual, whether it’s a Christmas hymn, and whether it’s an Easter hymn. Most of this information was gathered from the church’s About the Hymns resource.
The model appears to satisfy the assumptions of a linear regression model. The residual were normal, according to a Shapiro-Wilk test of normality (\(W\) = 0.976, \(p\) = rp_resid`). Other model assumptions, like homogeneity of variance in the residuals and no influential observations, were also met. Overall, the model was a good fit to the data with a multiple \(R^2\) of 0.677.2
2 In my professional life, I am an academic who works with linguistic data. I’m not used to \(R^2\) values this high. Some people reading this may come from other fields that study phenomena more exact than human behavior, but I’m thrilled to get an \(R^2\) that high!
In the discussion that follows, I’ll now go through each of the model predictors one by one. Since the model was on transformed predictors, I took the predicted values and did the inverse Box-Cox transformation on them. That allows me to put more interpretable numbers on the comparisons and say what effect some varible has on the popularity of hymns, all things being equal.
Batch
I’ll start with the batch. One trend that I saw in the plot above was that many of the hymns in the earlier batches are closer to the top and many of the hymns in the later batches are close to the bottom.3 Here’s a plot showing that relationship. I’ve ignored the holiday hymns since they don’t quite fit the pattern.
3 I didn’t include hymn number in the statistical model but, the correlation between hymn number and frequency is statistically significant according to a Kendall’s rank correlation test: \(\tau = -0.5638\), \(z = -5.8325\), \(p < 0.001\).
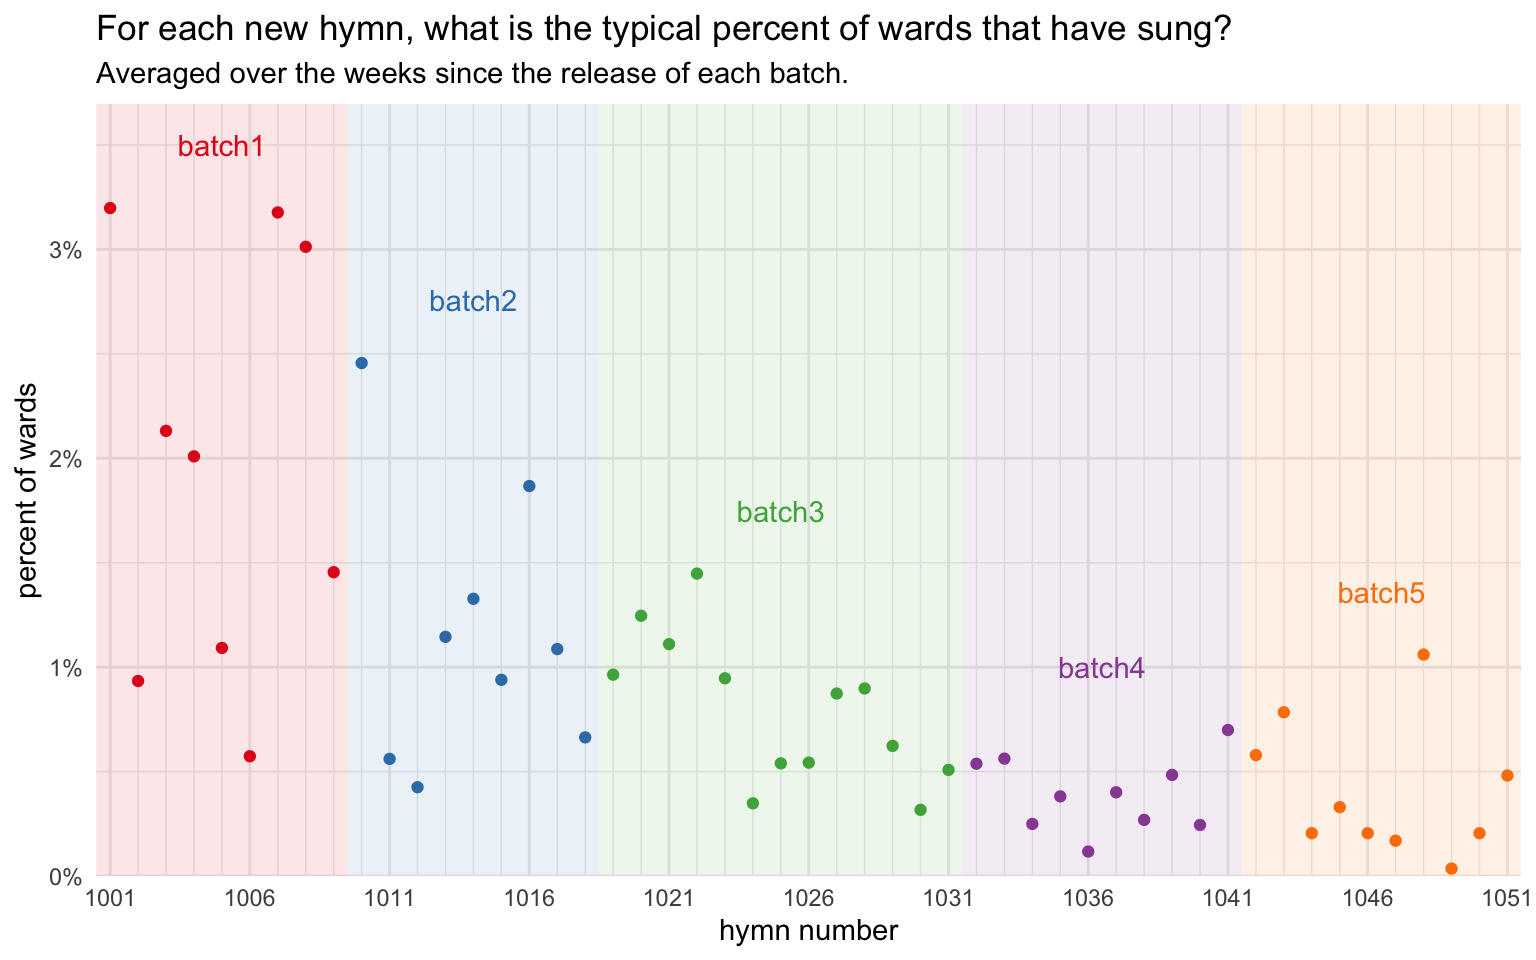
Now, at first glance, you might be thinking “well, of course the first batch is sung more; it’s been out longer!” But these are numbers averaged over the lifetime of that batch. So for a hymn like
4 Specifically, at the time of writing, it was sung 1,517 times out of 47,435 sacrament meetings I have data from between May 30, 2024 and January 28, 2026.
5 I’ve seen it sung 119 times out of 11,223 sacrament meetings between September 18, 2025 and January 28, 2026.
The statistical model suggests that, all else being equal, the third, fourth, and fifth batches are sung less than the first two. Specifically, compared to the first batch, the third batch was sung in 0.74% fewer sacrament meetings each week, which makes the first batch 2 times more common. The fourth batch has been sung in 1.04% fewer sacrament meetings each week, which makes the first batch 3.32 times more common than it. And the fifth batch has been in 1.06% fewer meetings each week, making the first batch 3.46 more common. Again, all things being equal. The second batch was a little less than the first batch (0.4%), but the difference was not statistically significant.
Note
These percentages may not seem big, but keep in mind that the most common new hymn has been sung in about 3.2% of sacrament meetings, so we’re not working on a large scale here. So a difference of 1%, relative to the range of numbers we’re looking at, is pretty big.
I have two potential explanations for why the later batches have been less popular. First, the church might have selected for inclusion in the first batch hymns they knew were going to be popular. I think the presence of
6 Although, as shown below, that hymn doesn’t have an especially large residual, so it’s not an outlier once everything is accounted for.
The other explanation is the novelty of the first batches. There was a lot of excitement leading up to the first batch, so when it was release, it exploded into sacrament meetings and since been very well-integrated. I believe the second batch was riding on the first batch’s coattails, I think. Once the third batch came out, it had been over six months and I think people’s excitement was waning. It has taken longer for the third and subsequent batches to get incorporated into sacrament meetings. From what I can tell, fewer wards are taking time out of church meetings (like special sacrament meetings or fifth Sunday lessons) specifically to sing new hymns. I know some people feel overwhelmed with the sheer number of new hymns and maybe don’t feel like they can start the later batches until they’re satisfied with the earlier ones. The point is this though: there is a clear novelty effect.
I suspect that hymns from the first and second batches will remain favorites for many years. I think a safe prediction is that
Arrangement
There are two main kinds of arrangements in these hymns.7 About 37 hymns are SATB arrangements, or rather, they’re written in four-part harmony. Most hymns in the hymnal are like this and when you look at them, they “look” like something that fits within a hymnal. The other 23 hymns are arranged for unison singing.8 These are ones where everyone sings the melody. They’re often thought of as being for children since they “look” more like they fit in the Children’s Songbook.9 My question is whether the type of arrangement has a significant influence on how popular a hymn is, all other things being equal.
7 Actually, there’s a third category, arranged for a duet.
8
9 A recent update to Chapter 19 of the General Handbook makes it clear that these songs are suitable for congregational singing. I think this was in response to a widespread belief that they were not.
This plot is the same as the one shown above, where the hymns are in order of how popular they’ve been. The only difference is that I’ve colored them by whether the arrangement is SATB or unison.
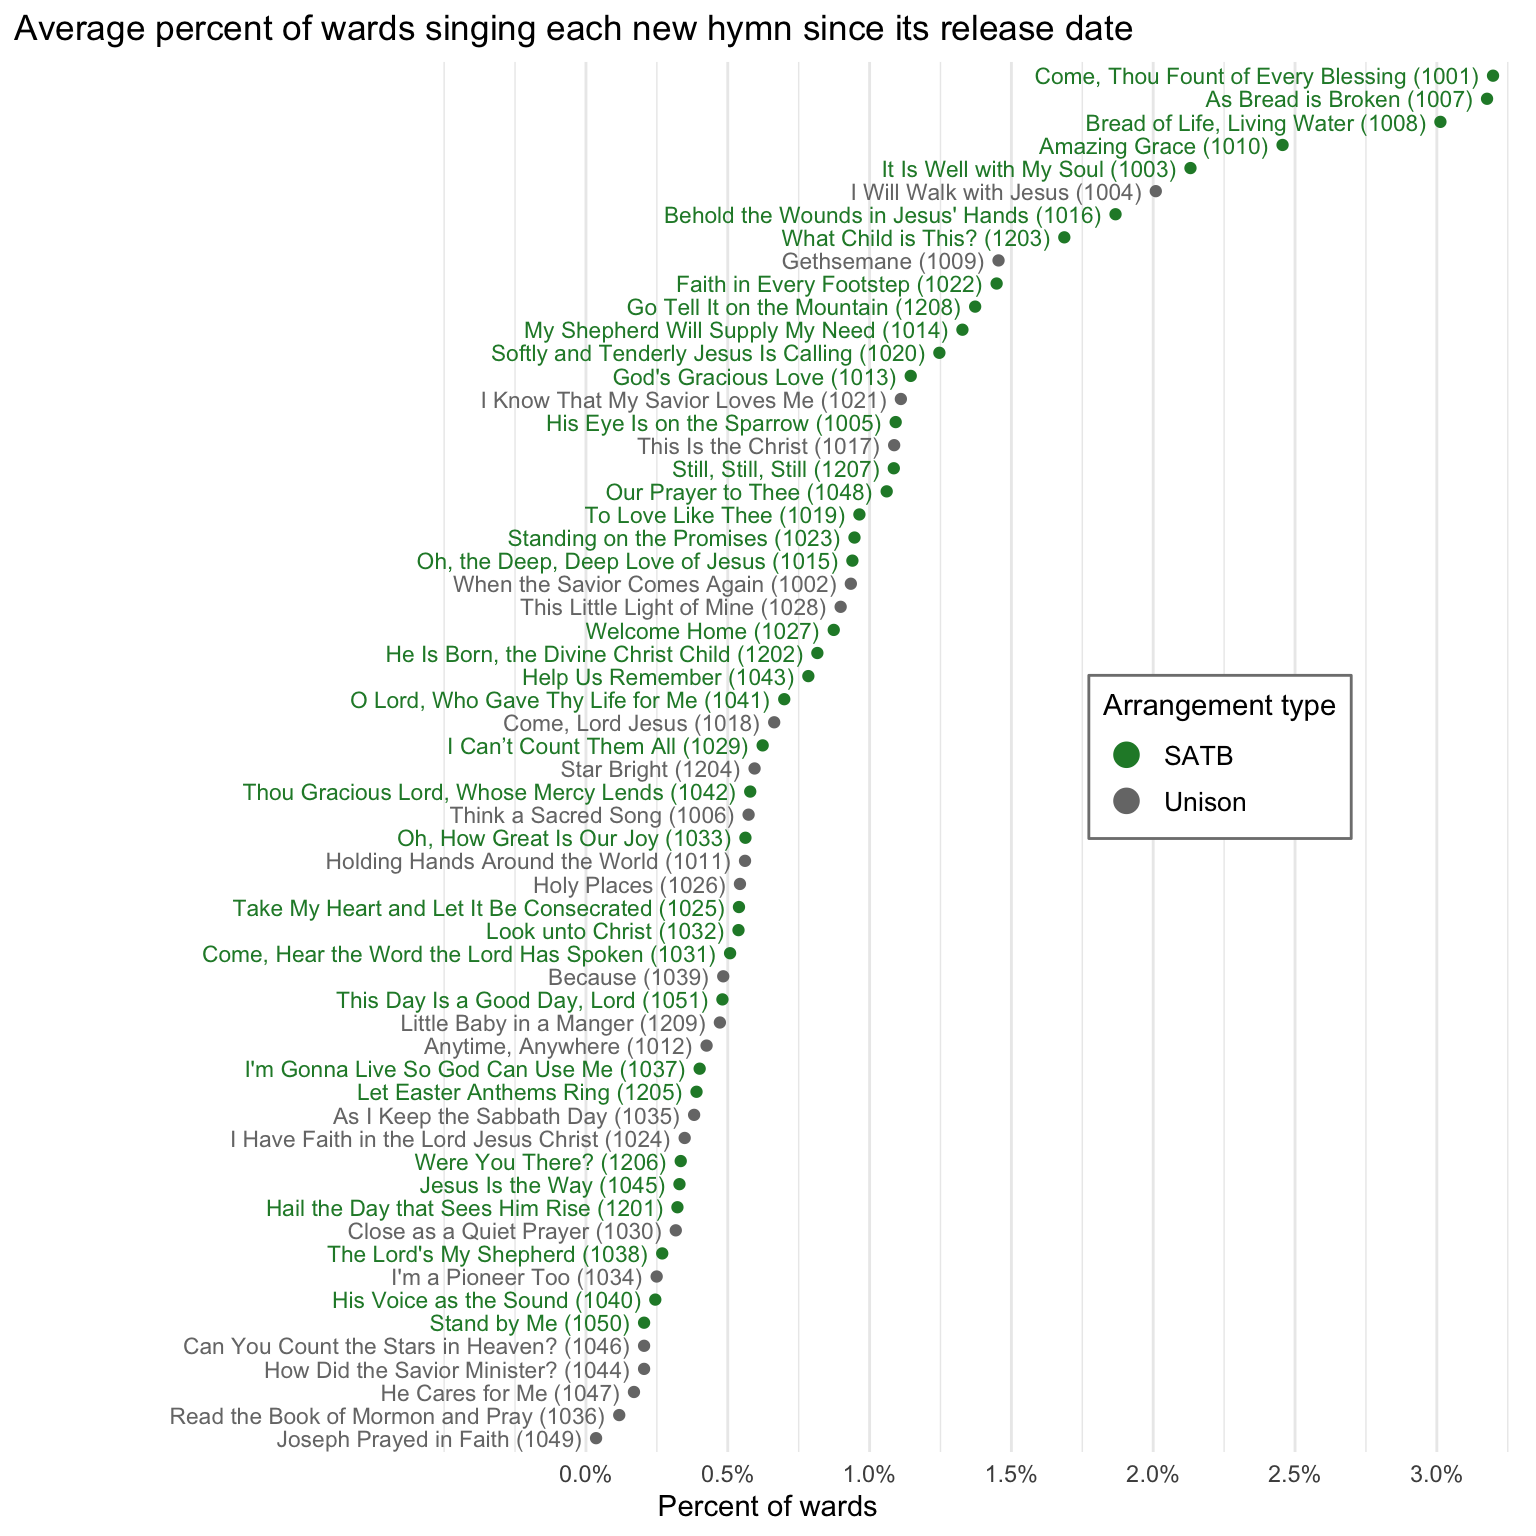
It’s not a super obvious trend, but there is a clear tendency for SATB arrangements to appear closer to the top of the chart and for unison arrangements to appear closer to the bottom. The statistical model supports this. In fact, other than what batch a hymn is in, whether it was an SATB arrangement was the strongest predictor. All other things being equal, unison hymns were sung 0.42% fewer sacrament meetings than SATB hymns. To put it another way, SATB hymns are 1.72 times more likely to be sung, all things being equal.
One could speculate a little bit about this. If
I think the reason for why SATB arrangements are more popular I think is just that people who grow up in our Latter-day Saint musical culture often associate SATB with congregational singing and unison singing for children. The justification is that most hymns in the 1985 hymnal are arranged in SATB and most songs in the Children’s Songbook are in unison. Another reason is that the unison pieces aren’t quite as conducive to play on the organ, and some people are hesitant switch over to piano.
I have a lot of thoughts about all this, so I’ll keep my comment brief. To be clear, the organ is capable of playing more than hymns arranged in SATB. A decent organist should be able to adapt pieces to sound better on organ if they need to (and organists should be willing to learn this new skill if they don’t have it already). Furthermore, we don’t have to use the organ in church. Hundreds of meetinghouses around the world don’t have one and they have just as rich, fulfilling congregational singing as those that do. So whether a hymn is suitable for organ should be irrelevant.
Something else I’ve heard is that some people feel that unison singing is not suitable for congregations because the melody goes too high for people with lower voices, so having harmony lines allows everyone a chance to sing. As someone with a limited upper range and who can comfortably sing relatively few of the melodies in the 1985 hymnal,10 I sympathize with this. But I think this argument greatly overestimates how many people actually sing harmony lines. People who are not musically inclined or who can’t read music just adapt if they want to sing still, and they often do so by singing the melody down an octave. I don’t think anyone who encounters a unison piece will think, “well, I guess this one isn’t for me”. Personally, if a piece calls for unison and I really don’t want to sing that high, I can always sing along to some lower harmony or bass line. I’m also fine having to switch to a weaker singing voice to sing the melody—that’s not going to affect my ability to worship through song. In fact, I have had great experiences singing the unison arrangements in church.
10 See this blog post on an analysis of the highest notes in melody lines.
Flow
The next variable I want to probe is what I’m calling the “flow” of the piece. Most hymns in the hymnal have straightforward structure: start at the top, sing to the bottom, and repeat. However, a few hymns have some slight modifications to this, such as
The latest batch has a few of these kinds of changes to the flow. Two of them (
But there are four that stand out as having new kind of “flows” to them.
The statistics don’t support this hypothesis. Hymns with a new flow were indeed predicted to be less commonly sung than hymns with a more standard flow, all other things being equal. Specifically, new flow hymns were sung in about 0.16% fewer sacrament meetings per week. In other words, standard flow hymns were about 1.23 times more likely to be sung. This is not a statistically significant difference though. So it looks like the hesitancy that some music coordinators have hasn’t stopped too many of them from singing these hymns.
Sacrament hymns
I’ve written already that most of the most popular hymns are sacrament hymns. This makes sense because every sacrament meeting has to have one, so they collectively have to make up between a third and a quarter of all hymns sung. In these new batches we have eight hymns that are tagged as being appropriate for the sacrament. You can see which ones these are and how common they are in this plot.
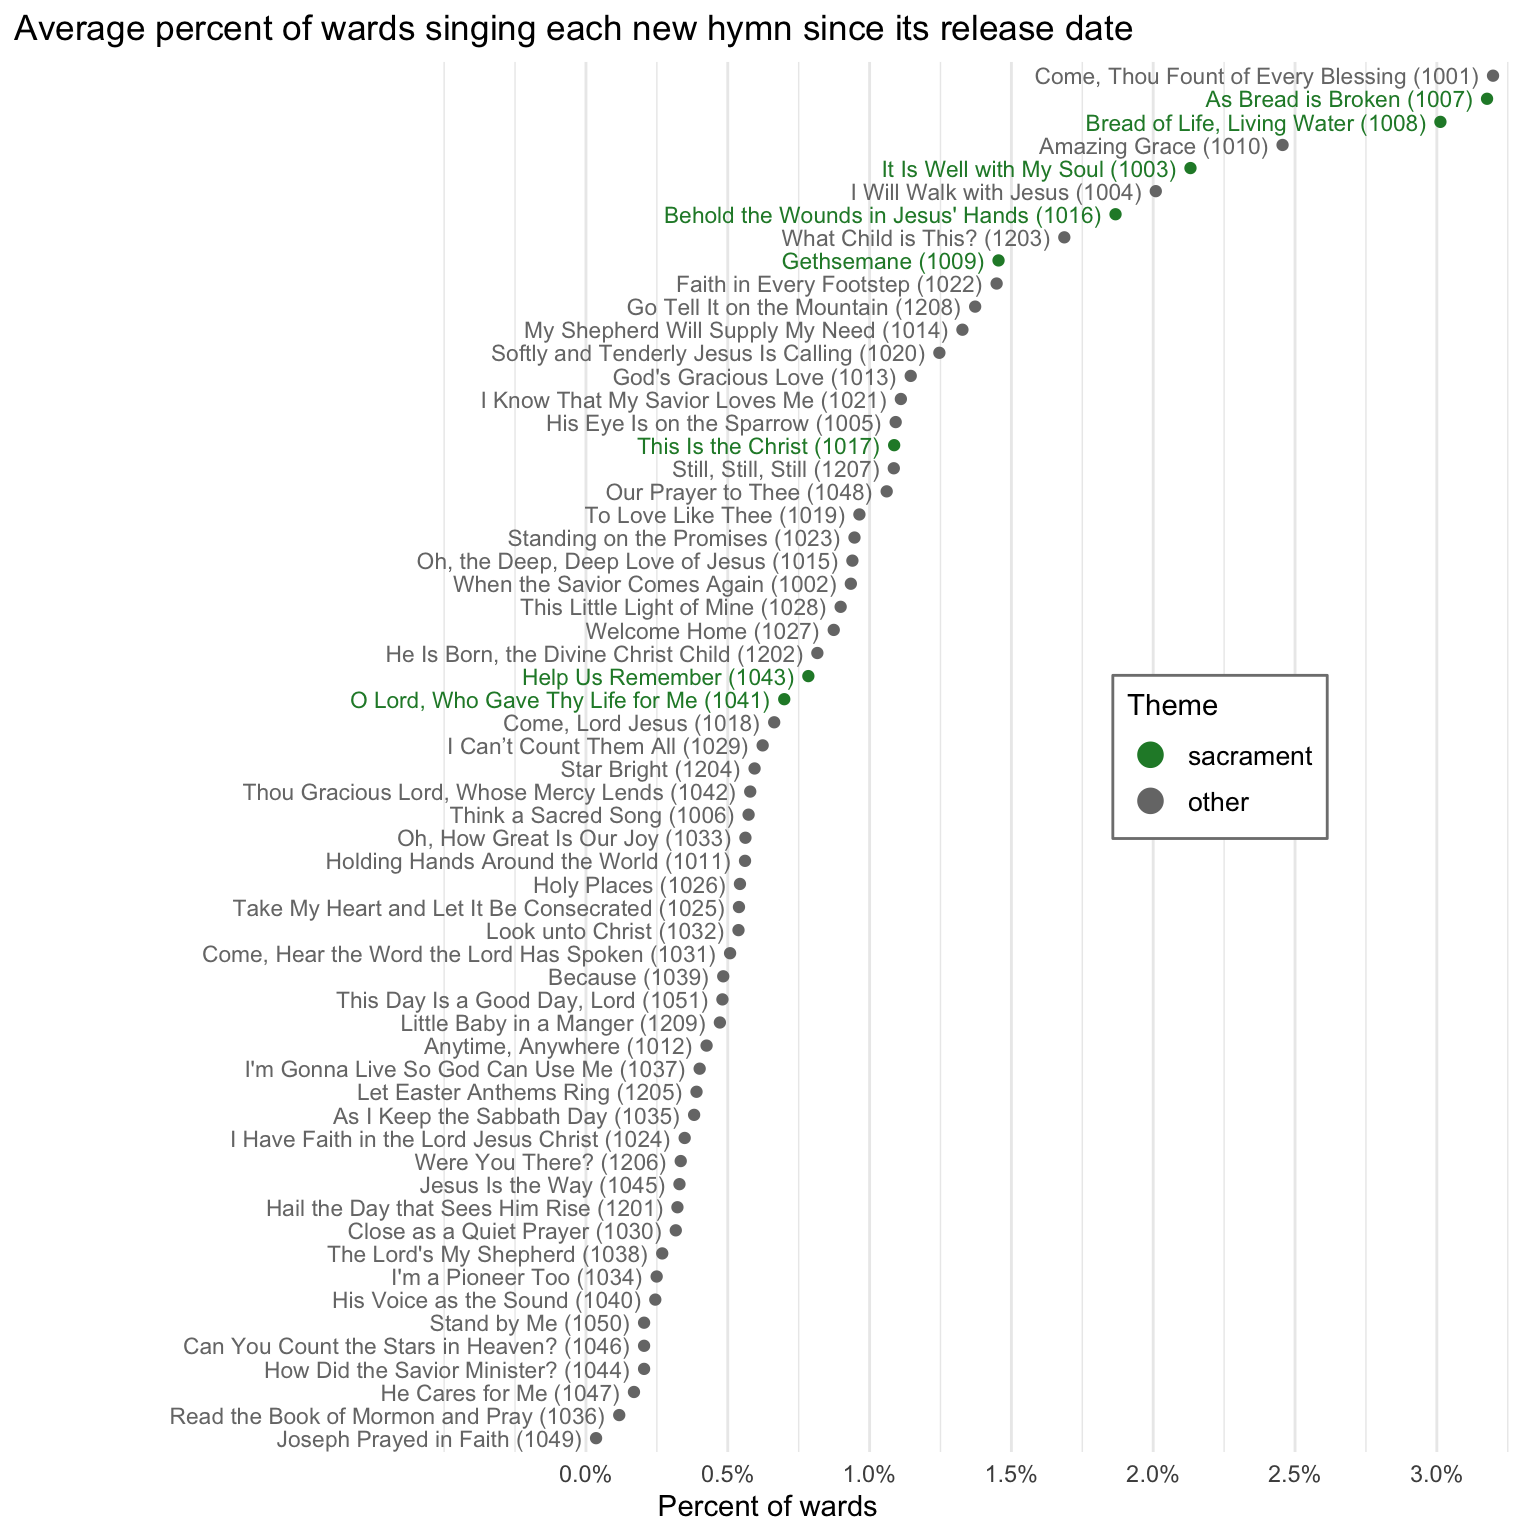
As expected, most of the sacrament hymns are near the top of this plot, so they’re generally sung by a fair number of wards each Sunday. The two that stand out for being lower than the rest are
The statistics give mixed results. On the one hand, it appears that sacrament hymns are quite a bit more common. A hymn predicted to be sung in 0.97% more wards each Sunday if it’s tagged as a sacrament hymn than if not. That equates to it being about 2.37 times more common than it would have been. That seems like a big jump. But the statistics suggest that it’s perhaps not a significant difference (p = 0.0205). So, we’ll wait for a few more months to see if that changes. Perhaps with more data and more new sacrament hymns, we might see that change.
Existing hymns
Next, I want to look at whether a hymn’s previous existence in the Latter-day Saint or Christian world has an effect on its popularity. Here, I have four categories that I’ve tagged independently of each other (that is, as four binary variables).
Existing hymns in American LDS culture
First are hymns that existed in Latter-day Saint culture before the new hymnal came out. A great example of this is
It turns out that, all other things being equal, if a hymn was previously a prominent part of the Latter-day Saint music world, it was more likely to be sung as a congregational hymn in sacrament meeting (p = 0.022). Specifically, it was sung by 0.56% more sacrament meetings each week.11 This is means that existing hymns are sung about 1.76 times more often than other hymns. This figure shows that almost all existing hymns are among the top 50% of most common new hymns.
11 As a reminder, this may not seem like a lot, but we’re working with a range of 0% to 3%, so a half percentage point difference is pretty big.
New hymns are regularly introduced into the Latter-day Saint cultural collection. Some come through formal means, like publication in the Friend or some other church material. Others come more organically as composers and songwriters release them and they catch on. I think people get excited when the see a song they have been singing for years get “canonized”. The new opportunity to sing these as congregational hymn likely explains why they are more popular.
Existing hymns in other LDS hymnals
The next category are hymns that existed in other languages of the hymnal, but not in English. There are a handful of these like
It is worth pointing out that most of my data comes from the United states. These new ones might be very popular in those countries. I don’t have any data from France, Tonga, or Sweden since these hymns came out, so I have no way of knowing right now if they are more popular there than in the US.
Existing Christian
The third category of hymns are ones that are popular in other Christian hymnals but, for whatever reason, haven’t been in ours. These include hymns like
African American Spirituals
The last category are African American Spirituals or hymns that originate among African Americans. There are four that I know of:
Other factors?
There are of course numerous other factors that go into how popular a hymn is generally. The ones I’ve discussed in this post are just some of them. But, even if I added a dozen more factors into the statistical model, there would still be some hymns that buck the trend. Ones that are simply more popular or less popular than we’d expect. Sometimes a hymn is just good (or bad) without any real reason.
The cool thing is that with this statistical model, I can actually quantify that a little bit. In the kind of statistics I’m doing, the model tries to guess how popular each hymn is, given what I’ve told it about them and how similar kinds of hymns are. It does it’s best to find the most significant trends, but it will inevitably be off by at least little bit on all of them. (It’s like trying to connect all the dots on a page with a straight line: you can get close for some but you’ll never be able to connect all of them.) I can extract from the model exactly how far off each hymn was from where the model guess it was, and then plot those numbers.12 Here is that plot.
12 For those who know stats, I’m just plotting the residuals.
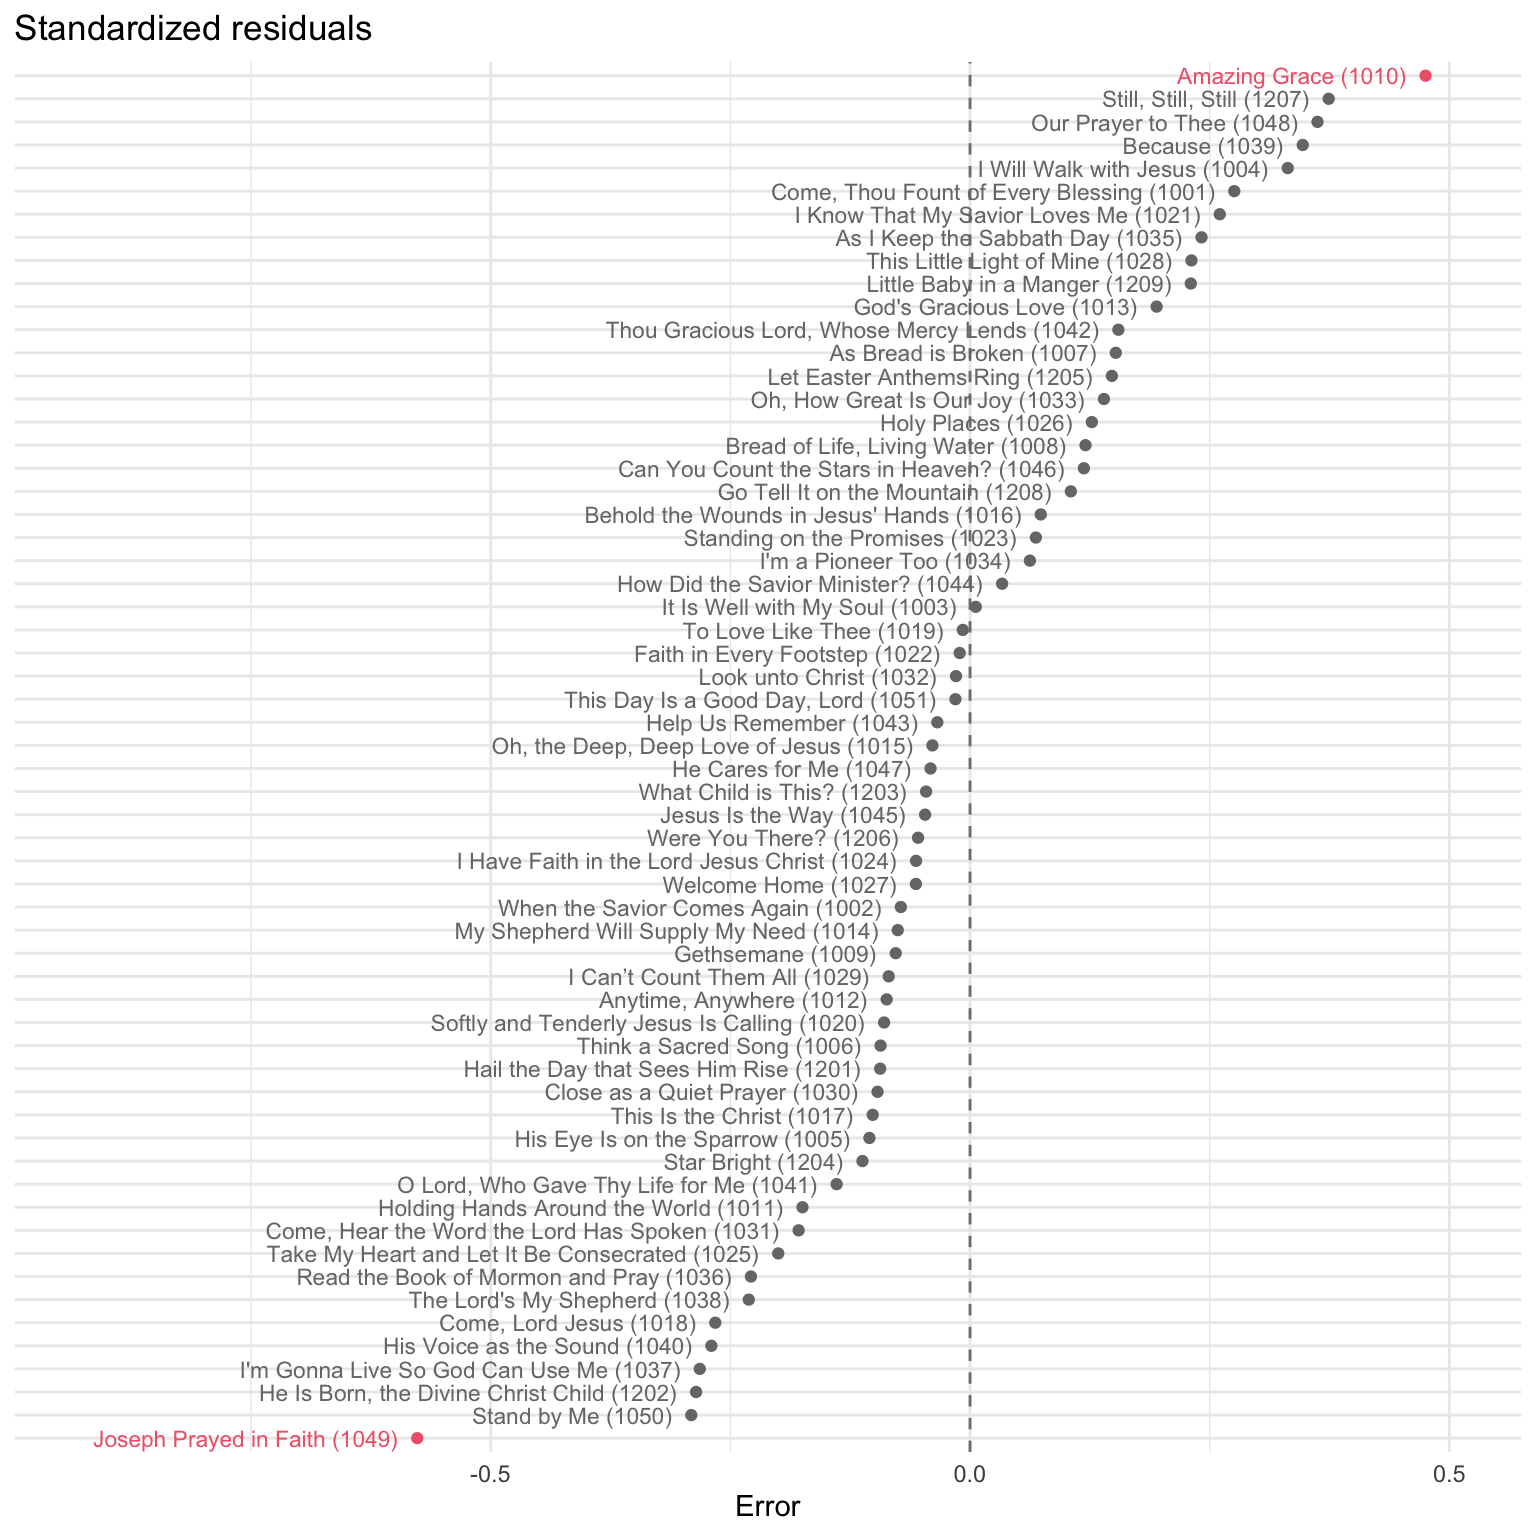
Unfortunately, the numbers along the x-axis aren’t very interpretable, so it’s impossible to say, for example, how much more often a hymn is sung than the model expects it to be. But, what is interpretable is the relative position of the hymns to the vertical line at zero. If a hymn’s dot is to the right of that zero, it means it was sung more than what the model guessed. If it’s to the left, it was sung less than it expected. Hymns marked in red were the ones that stood out as being quite a bit off from where the model guessed them to be.13
13 I just scaled the residuals, and they’re the ones where the absolute values of the z-scores were greater than 2.
One way to think about the horizontal position on this chart is that it represents all the other unmeasurable factors that go into whether a hymn is popular or not. Sometimes, people just like a hymn and sometimes they don’t. The horizontal position captures those vibes, whatever they are.
Starting with the extremes, we see that
On the other end, we have
There are a few others on the upper end of the plot that are interesting and that are worth pointing out. I’m not surprised to see
As for others on the lower end, I can only speculate. I know that a lot of people are uncomfortable with the word gonna in
Anyway, I could speculate on and on about these, but the point is that there is a lot of unexplained variance leftover in the statistical model. When I think of potential factors, I’ll add them to the model and the dots in this plot will gradually tighten. But in the meantime, it’s intersting to see these trends.
Conclusion
In this post, I took data from 62,081 sacrament meetings and looked at how many times new each hymn has been sung in sacrament meeting, on average, since its respective release date. The most common, unsurprisingly, is
I then looked at whether certain properties of hymns had an influence on how popular they have been. Here’s what I found:
- The first batch is far and away the most common. All things being equal a hymn in that batch is sung 2 more often than one in the third batch, 3.32 times more often than one in the fourth batch, and 3.46 times more often than one in the fifth batch. The second batch was less popular, but not significantly so.
- A hymn that is arranged in an SATB format is sung 1.72 times more often than one arranged for unison singing, all other things being equal.
- Whether a hymn has a complex flow did not significantly affect how often it was sung.
- Sacrament hymns are sung 2.37 times more often than an equivalent non-sacrament hymn would be.
- Hymns that have existed within American Latter-day Saint culture for a while were 1.76 more likely to be sung. If a hymn existed in non-English Latter-day Saint hymnals, has been sung in other Christian denominations, or started among African Americans, it didn’t affect how often it was sung.
This has been one of my more technical blog posts. But, I think I’ve uncovered some pretty cool trends here. The most interesting is that there is a bias towards hymns that came out in the first batch or two. And there’s a clear preference for SATB hymns, rather than unison ones, being sung as congregational hymns in sacrament meeting. Again, the church only recently stated explicitly that both styles are appropriate, so we’ll see if the popularity of those unison hymns goes up.
If you can think of some potential predictors for what might make hymns more or less popular, let me know and I can upate my model!