| percent of hymns sung | percent of hymns in the hymnal | number of hymns |
|---|---|---|
| 10% | 2.0% | 8 |
| 20% | 4.2% | 17 |
| 30% | 7.2% | 29 |
| 40% | 10.7% | 43 |
| 50% | 15.2% | 61 |
| 60% | 20.4% | 82 |
| 70% | 26.7% | 107 |
| 80% | 34.4% | 138 |
| 90% | 46.9% | 188 |
The 80:20 rule
When talking to people about this hymn stats project, I often hear comments that make reference to the 80:20 rule.1 These comments suggest (usually disparangingly) that 80% of the hymns sung come from 20% of the hymnal. This is something I’ve never looked into directly, so I thought I’d do a brief analysis to see whether these proportions are indeed real.
1 This is more formally called the Pareto Principle.
Methods
To do this analysis, I had to make some methodological choices. In particular, I had to clearly delineate what counts as a hymn. If we include all hymns that I’ve ever seen in the 90,000 or so sacrament meetings I have data for, that about 512 unique entries. That includes anything from the 1985 hymnal, the new hymns that have come out, 93 different entries from the Children’s Songbook, and another 24 hymns that are either not in the English hymnal or are just other hymns that wards choose to sing. For the purposes of this post, I’ll just focus on the 1985 hymnal and the new hymns that have come out recently. Adding all the other ones increases the denominator in the calculations and when people talk about the 80:20 rule in the hymnal, I don’t think they’re thinking about them anyway.
Here’s the method to see how close we are to the 80:20 rule.
- I started by taking all 284,216 individual data points I have. Each data point represents an instance of one congregation singing a hymn. So a single sacrament meeting usually contributes three or four observations.
- After filtering out anything that isn’t in the green hymnal or one of the new hymns, I then counted how many times each hymn occurred in the dataset. For example,
I Stand All Amazed (#193) is the most frequent hymn and occurs 4,714 times in my dataset. - I then took those numbers and converted them to proportions. So, for example, I took the 4,714 instances of
I Stand All Amazed (#193) , and divided it by the 284,216 total observations to get a proportion of 0.0166 So, that one hymn makes up 1.66% of all the hymns sung in my dataset. - From there, I put the hymns in order from most frequent to least frequent, and calculated the cumulative percent. So, the cumulative percent of the first two hymns is the percent from the most common plus the second most common hymn,
As Now We Take the Sacrament (#169) , which ends up being 3.16%. I then go down the spreadsheet, adding the percents to the total amount, until I get to the bottom where it equals 100%. In the following table, that column is calledpercent of hymns sung. - To get a percent of how much of the hymnal corresponds to the percent of hymns sung, I created a new column that is the rank of the hymn, from 1 to 401, which is how many hymns we have between the two collections. I then rescaled those numbers so that instead of going from 1 to 401, they go from 0 to 1. That column is called
percent of hymns in the hymnal.
I know there are probably other ways of calculating this. The biggest factor is whether the new hymns should be included in the calculation. After going through multiple versions of this analysis, I think this method is the best one.
So, do we follow the 80:20 rule?
The full table was a little too long to show, so I’ve abbreviated it by highlighting ten or so landmarks. Here is that shortened table and the results of the analysis:
So, do we follow the 80:20 rule in our hymn singing? Not quite. I’ve highlighted the relevant row: about 80% of the hymns we sing in church come from 34.4% of the hymnal or 138 hymns. So a little over a third of them. The next row down shows that 90% of the hymns that we sing come from 46.9% of the hymnal, which is about 188 hymns.
So, we don’t follow the 80:20 rule exactly. We follow something like the 80:35 rule. Not as satisfying of a number, but that’s what is reflected in the data.
To get a feel for all the numbers and what the larger pattern is, here is a plot that shows the complete dataset. The green dots are the same numbers plotted on the table above and are positioned vertically at 10% intervals along the y-axis. The black line connects them and follows the rest of the points.
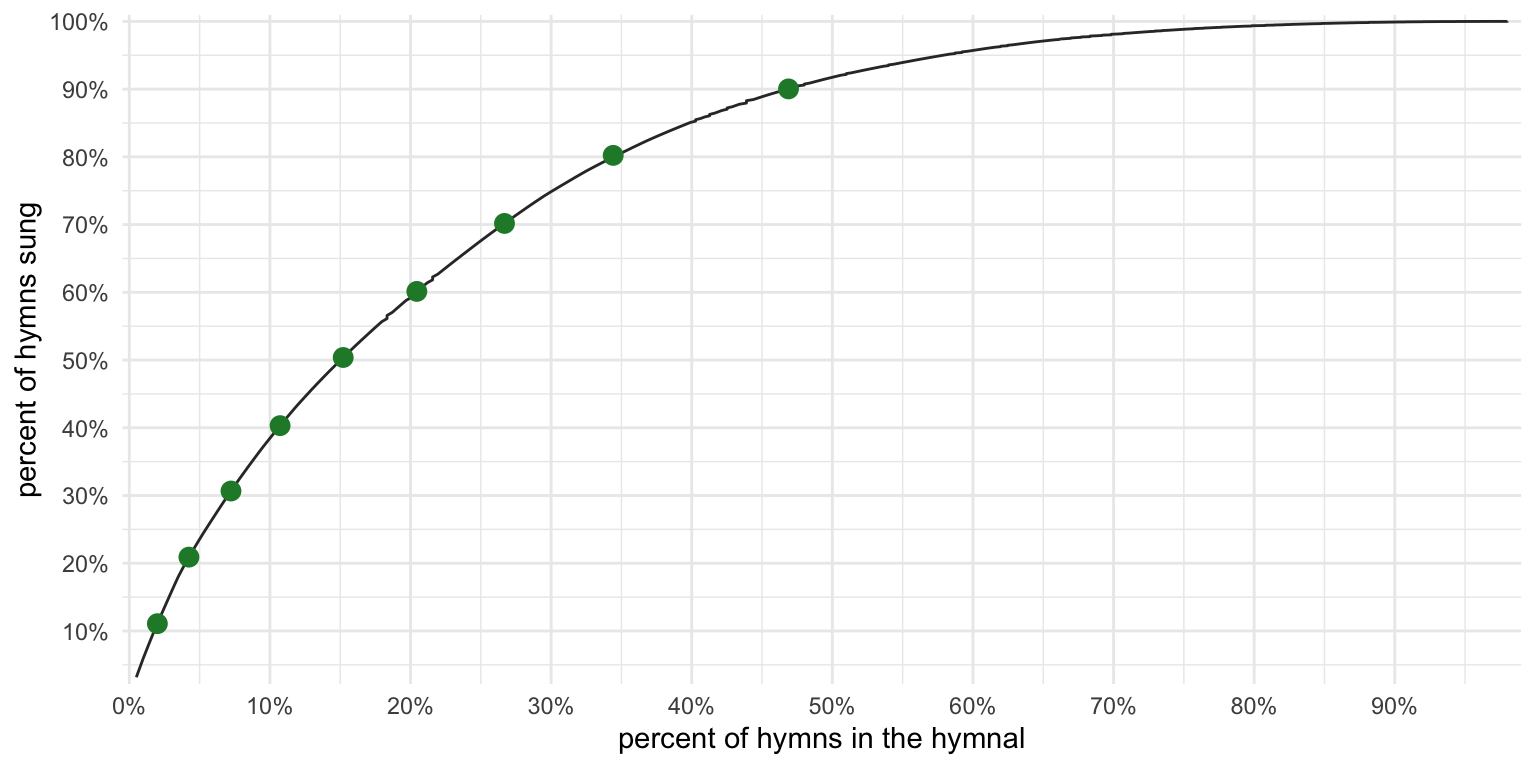
You can see that there’s a tapering off. A relatively small portion of the hymnal accounts for a large percentage of the hymns sung. But as we get into the infrequent hymns, since they’re sung so rarely, they contribute only a small amount to the hymns sung, so it takes many more of them to move the line up.
This plot shows that yes, about 90% of hymns that are actually sung make up less than half of the hymnal (including the new hymns). The remaining half of the hymnal (about 170 hymns), I’ve heard it jokingly called the “sealed portion.” So even though the “sealed portion” is just as big as the “unsealed” portion, it’s only makes up 10% of the hymns sung.
But that 10% isn’t nothing. On average, wards sing about 3.13 hymns per sacrament meeting. That means about once every four weeks you might expect a hymn from that “sealed portion.” You might sing 15 of these hymns a year. We can’t expect all hymns to be sung with equal frequency, and I’m glad we have the chance to change things up every few weeks and sing a less common hymn. Removing the “sealed portion” would only exacerbate the perceived problem of singing the same hymns all the time.
Does it change with the new hymns?
I was curious to see what the data looked like before the introduction of the new hymns. Here’s a table that is calculated in the same eway, but it only includes sacrament meetings from before June 2024.
| percent of hymns sung | percent of hymns in the hymnal | number of hymns |
|---|---|---|
| 10% | 2.3% | 8.0 |
| 20% | 4.7% | 16.0 |
| 30% | 7.9% | 27.0 |
| 40% | 12.0% | 41.0 |
| 50% | 17.0% | 58.0 |
| 60% | 22.9% | 78.0 |
| 70% | 29.6% | 101.0 |
| 80% | 37.8% | 129.0 |
| 90% | 50.0% | 170.5 |
So, prior to the introduction of the new hymns, 80% of the hymns sung came from 37.8% of the hymnal. So, a bit higher than the 34.4% we saw above. Granted, this is based on 341 hymns instead of 401 of them, and smaller denominators will result in a larger number if the numerator is the same. Higher numbers here reflect greater diversity in hymn selection. I don’t think that necessarily means we’re focusing on fewer hymns or that we’re singing the same hymns more so than we used to. I think people are excited about the new hymns and are choosing from that smaller pool rather than choosing from the 100 or so infrequent hymns in the 1985 hymnal.
Here’s a table that shows the same thing but since the introduction of the new hymns.
| percent of hymns sung | percent of hymns in the hymnal | number of hymns |
|---|---|---|
| 10% | 2.0% | 8.0 |
| 20% | 4.2% | 17.0 |
| 30% | 7.2% | 29.0 |
| 40% | 10.6% | 42.5 |
| 50% | 14.5% | 58.0 |
| 60% | 19.7% | 79.0 |
| 70% | 25.9% | 104.0 |
| 80% | 33.9% | 136.0 |
| 90% | 46.1% | 185.0 |
| 100% | 96.5% | 387.0 |
So the number drops a little bit to 33.9%. But, we’ve increased the denominator (total number of hymns), so the overall value will go up. Regardless of how I look at the data, the number is still right around 33%–38% of hymns. So I think it’s still safe to say that the pattern we follow is about 80:35, rather than 80:20.
Changes over time?
The above tables and plot are based on all my data pooled together. But I have data spanning many years. Is it possible that that 34.4% has changed over time?
The following plot shows the same calculation that I described above, but split up by year. I only show from 2015 onward since my data from before then is a bit sparse and therefore unreliable. And I won’t show 2026 quite yet since we’re not far enough into the year to get a good reading of it. The y-axis on this plot shows the percentage of the hymnal it takes to hit 80% of hymns sung.
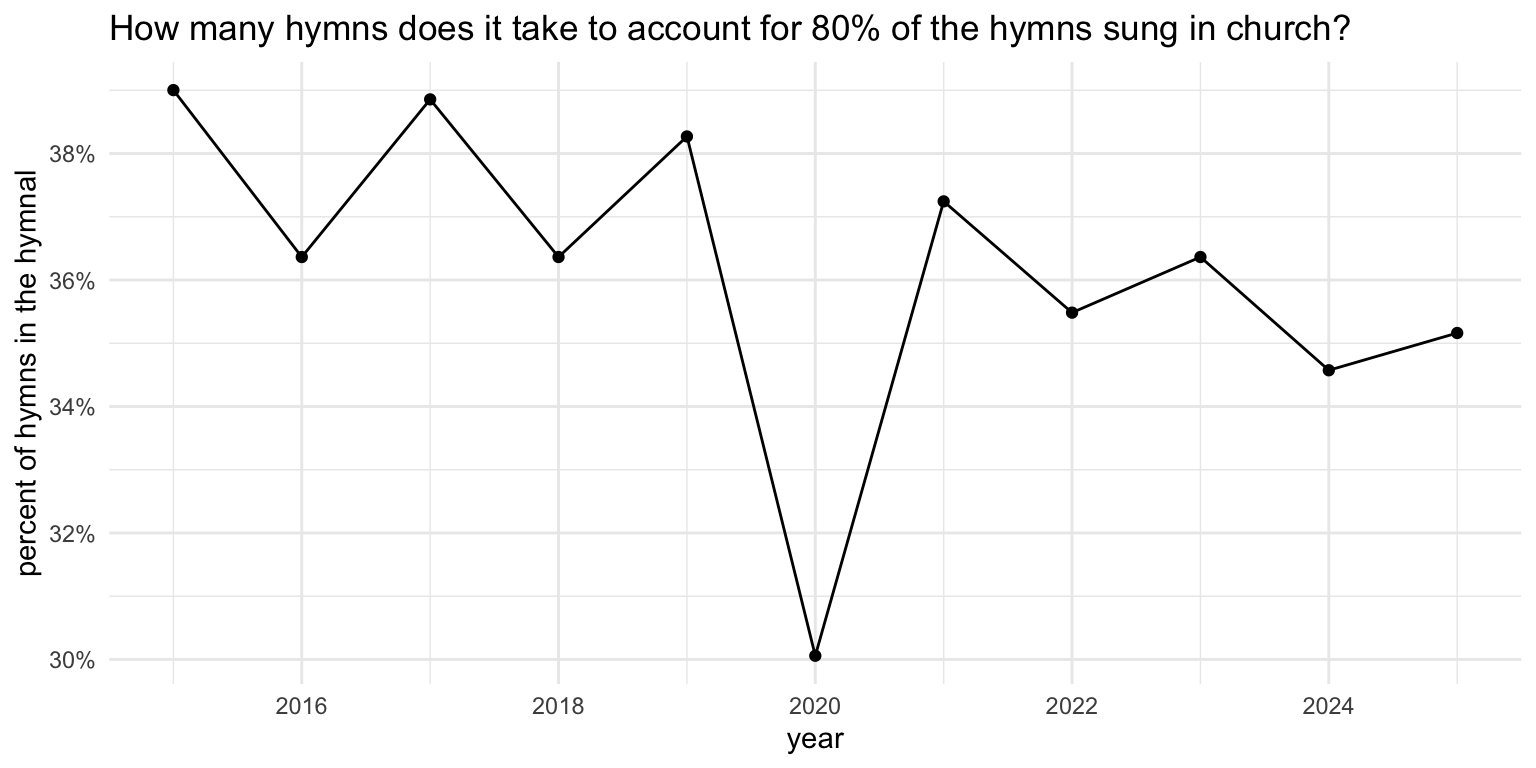
The most obvious thing in this plot is the dip in 2020. Fewer wards were having in-person meetings. And if they were, not many were singing all three hymns. So since many were singing just sacrament hymns, there wasn’t opportunity to sing too many other ones. I’ve noticed too that the other hymns that wards were singing then tended to be familiar favorites. So, there wasn’t a lot of hymn diversity in 2020. It makes sense then why it took only about 20% of hymns (102 of them) to account for 80% of the hymns sung in church that year.
The other less obvious trend is the general decline in the past 10 years. Again, lower numbers suggest less hymn diversity in our meetings. However, I’m not 100% convinced this trend is real because the number is dependent on how much data I have and on how many hymns are available at that time, which is not consistent across the years represented in this chart. Maybe the trend in the church generall is indeed real, but if it is, it’s not a very strong pattern, certainly not strong enough to be percieved by people.
Conclusion
So that’s it. Not too much more I could say here. About 34.4% of the hymnal accounts for 80% of the hymns sung. So, not quite 80:20.
While this post is largely to satisfy my curiosity, there is one useful application for this. Pianists and organists, particularly new ones, may want to prepare a smaller set of hymns until they’re comfortable sight-reading from the hymnal. Knowing that they would only need to learn 34.4% of hymns to cover 80% of the hymns sung in church may be comforting thought. Or, going back to one of the plots above, learning only about 15% of the hymnal is enough to play half the time. Someone in this position may want to consult the overview page to see a list of hymns in order of frequency. They may find that by learning them in that order is an efficient way to quickly get involved in providing music for church meetings.
While 34.4% may seem low to some people, in fairness, I think lots of things in nature and in human behavior behave this way. Particularly categorical variables like hymns in a hymnal. I don’t see this as a flaw or a problem at all and I think we should enjoy the infrequent hymns when they come up and enjoy the frequent hymns when they are sung.