| Number of wards I have data from, by week | |
|---|---|
| Since February 16th | |
| date | wards |
| February 16 | 574 |
| February 23 | 461 |
| March 02 | 625 |
| March 09 | 572 |
| March 16 | 529 |
| March 23 | 560 |
| March 30 | 523 |
| April 13 | 666 |
| April 20 | 543 |
| April 27 | 390 |
| May 04 | 405 |
| May 11 | 80 |
| May 18 | 183 |
| May 25 | 113 |
| June 01 | 489 |
| June 08 | 563 |
| June 15 | 607 |
| June 22 | 529 |
| June 29 | 455 |
| July 06 | 731 |
| July 13 | 766 |
| July 20 | 691 |
| July 27 | 661 |
| August 03 | 736 |
| August 10 | 539 |
| August 17 | 431 |
| August 24 | 597 |
| August 31 | 652 |
| September 07 | 435 |
| September 14 | 421 |
| September 21 | 17 |
One Year of New Hymns
general
new hymns
It has been one year since the first batch of new hymns has been updated. In this post, I want to give a general overview of how these hymns have been used as congregational hymns in sacrament meeting. This will overlap partially with my dedicated posts on the first, second, and third batches, but it also presents some new analyses now found in those posts.
The data for this post is based on
Incorporation
First, let’s talk about how often these hymns collectively have been sung in sacrament meetings. This plot
How many wards sang new hymns each week?
The following plot show what percentage of wards sang from each of the new batches of hymns, per week, since June 2024 when the new hymns started getting rolled out. I’ve included data from all three batches just so you can compare them to each other.
Ignoring unknown labels:
• fill : "date"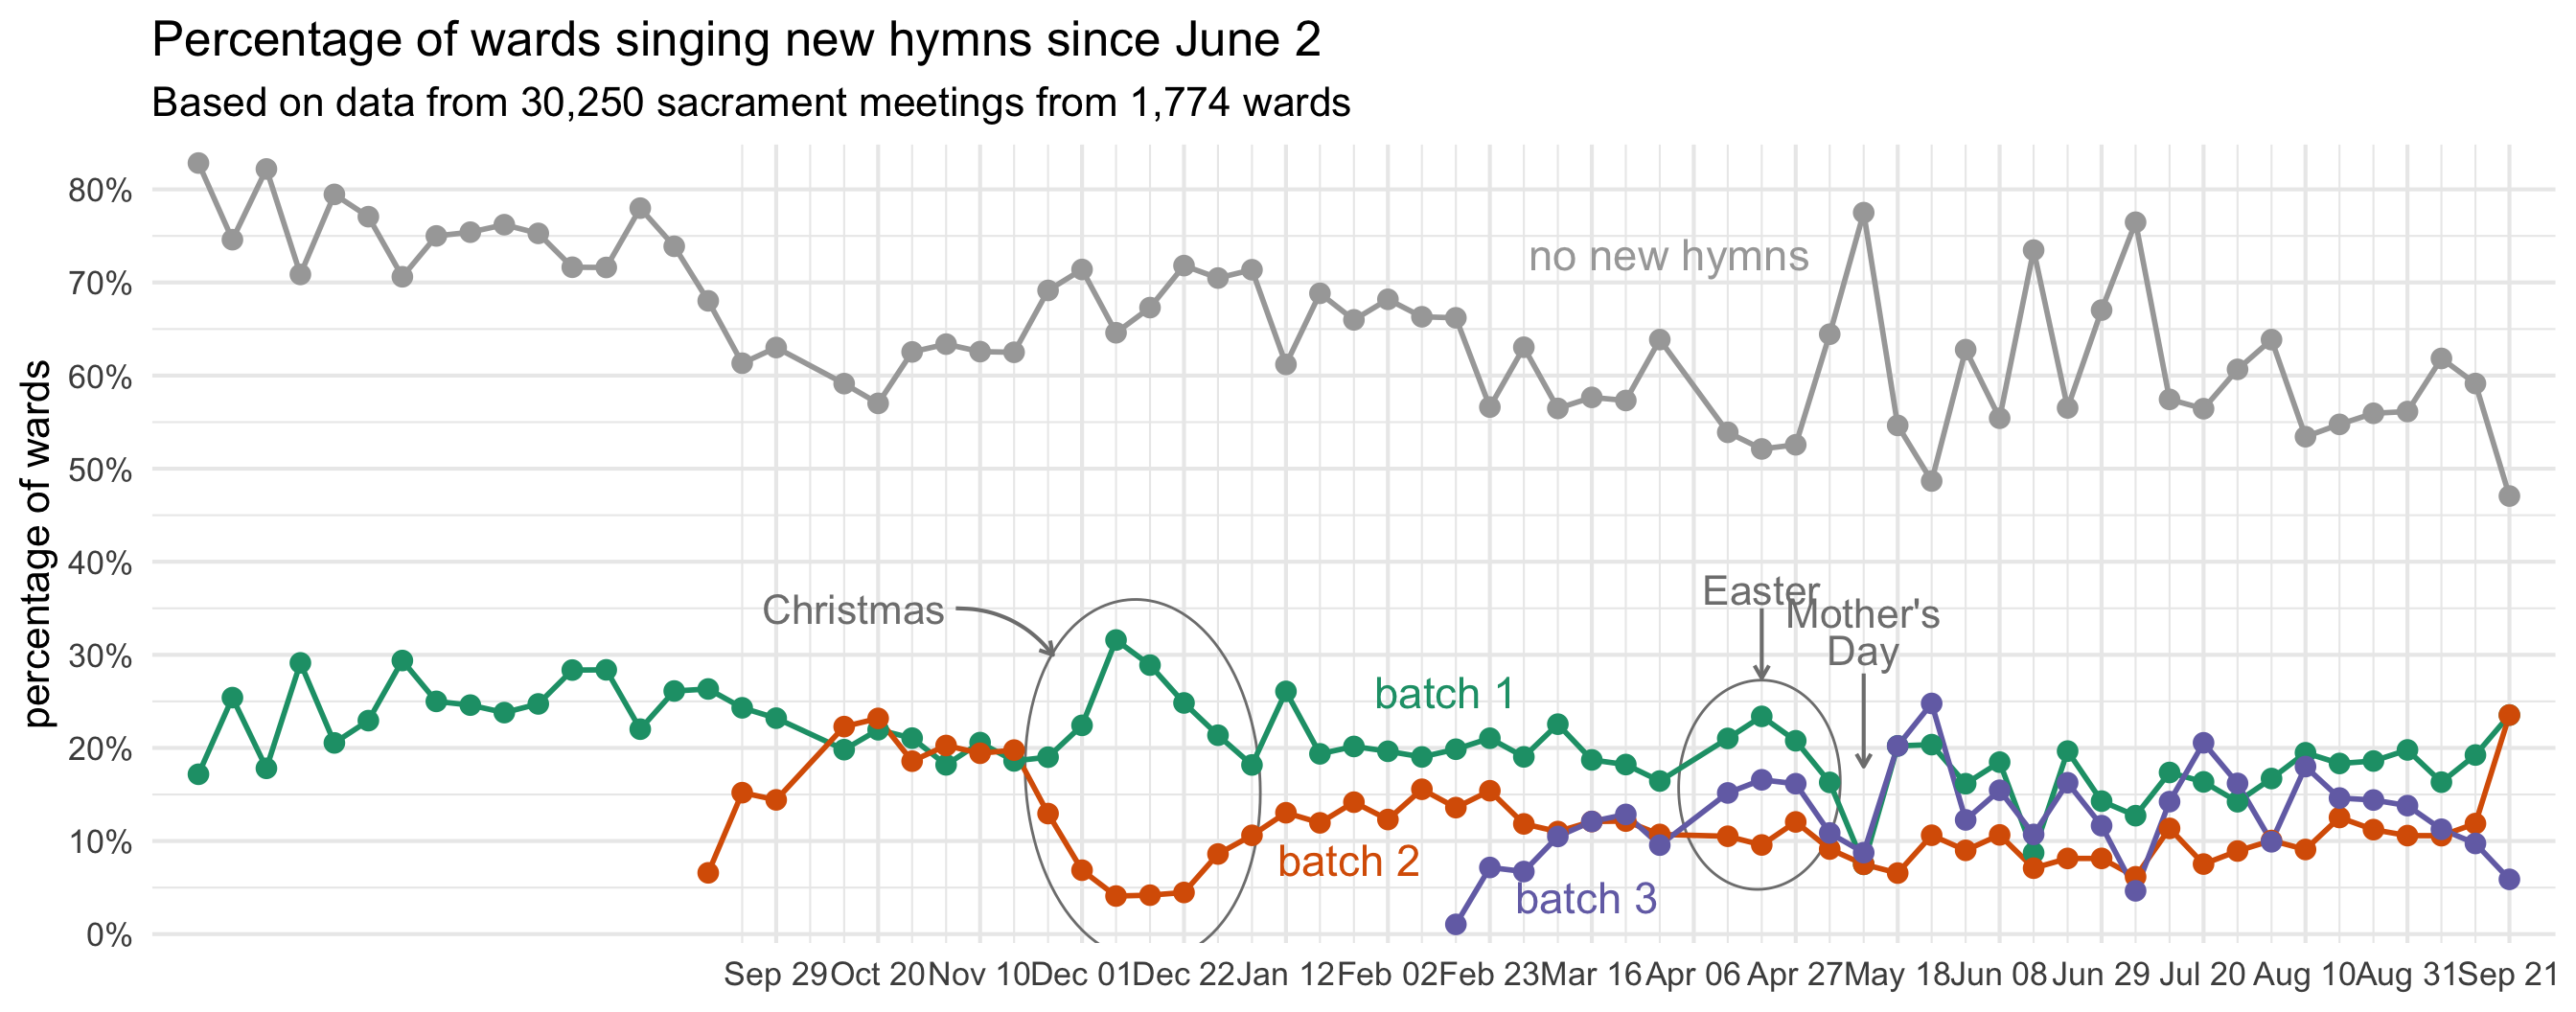
Same plot, but with the start times overlayed.
Popularity
How popular are each of the new hymns. Normalize to number of weeks of being available. Account for holidays. Account for sacrament hymns.